We went solar and here are the real numbers
As a progressive, data geek, and homeowner, solar panels were hard to resist. After moving into our new home in 2020, my spouse and I decided to invest in installing a solar panel array on our roof. When the panels went online in June 2021, I eagerly began crunching the numbers.

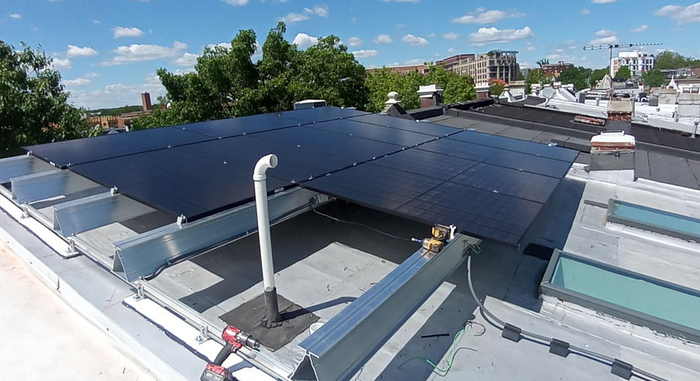
First, a shout-out to our installer Solar Solution who did a fantastic job and I highly recommend them if you’re in the DC area. (I know that makes this sound like a sponsored post, but it’s not, they really were superb.)
The Benefits
Renewable energy
First, the obvious: The energy we consume from solar panels is energy we don’t get from a “non-renewable” source. (I’m putting “non-renewable” in scare quotes because solar panel production is not renewable, and some portion of grid energy is renewable. But let’s leave that aside for now.)
Our 23 solar panels are rated to produce a total of 8.28 kilowatts (kW), but in reality energy production doesn’t get that high and maximum production is for a short part of the day. We peak at about 6.6 kW when the sun is highest in the sky and closest to the direction our panels face. The highest total energy production we’ll probably ever see in a day is 56 kWh, which we got on a bright, cloudless day a few days before the summer solstice (the day with the most daylight!) and only a few weeks after the panels were installed.

Topping out at 56 kWh in a day is pretty good. For comparison, in our first electric utility billing cycle after the panels were turned on, our house used an average of 53 kWh per day. Our solar energy production during the same time was, on average, 40 kWh per day. In a sense, 75% of our energy used that month came from the sun.
Our house is a typical city rowhouse/townhouse: tall and narrow sharing walls with our neighbors on each side. With a small footprint and skylights limiting the space for solar panels, DC’s hot summers requiring air conditioning, and so on, there isn’t room for enough panels on our roof to provide more power than we consume all the time, but it does provide more than we consume some of the time.
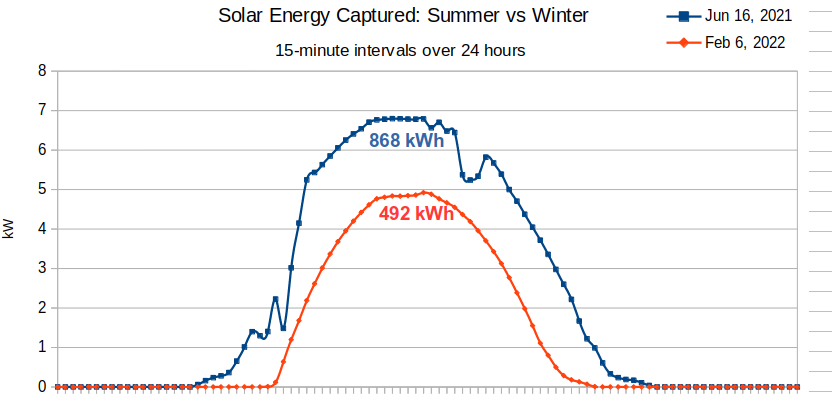
But what we saw in June is about as good as it gets. In the other seasons there are fewer hours of daylight and the sun is lower in the sky (which because of the angle of incidence also reduces energy capture), and so less solar energy. According to https://pvwatts.nrel.gov, June is about 25% brighter than the average month. The best summer days generate almost twice as much energy as the best winter days:
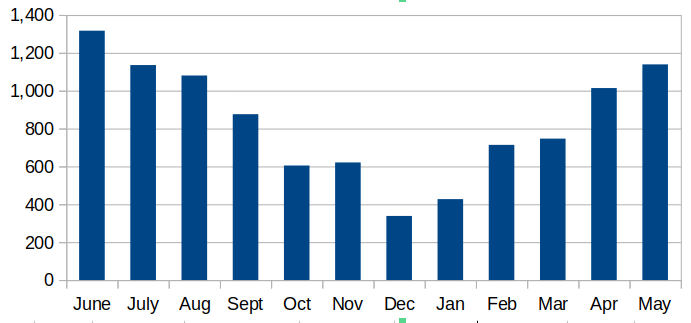
Over the first year, about 38% of our energy usage was powered by our solar panels. (Our furnace for heat in the winter is powered by natural gas rather than electricity, so for this calculation I included our gas usage by converting it into an equivalent amount of electricity.)
(The difference between a kilowatt (kW) and a kilowatt-hour (kWh) is really important: When you measure how much energy is stored in a battery you use watt-hours like kilowatt-hours for large house-powering batteries and the related unit milliampere-hour, mAh, that you’ve probably seen for phone batteries. The watt or kilowatt (no ‘hours’) is how quickly energy is being generated or drained at any given moment. If you generate 1 kW for an hour, you can fill a 1 kWh battery.)
Lower energy bills
Any electricity we produce ourselves is electricity we’re not going to billed for by our local power utility. Our local utility has complex tiered pricing depending on how much power is consumed, with rates that change from month to month, so it’s impossible to know for sure what we would have paid for energy we weren’t billed for. The marginal electricity rate shown on our bills varies from about 10 to 12 cents per kWh.
Over our first year with solar panels, each month I multiplied the marginal electricity rate on our utility bill by the total energy produced by our panels during the bill’s service period. We saw a probable utility bill savings of $1,058 over the year.
If you’re comparing this to your own system, that’s $128 per year per kW. https://pvwatts.nrel.gov can actually estimate energy savings based on your location and solar panel setup.
You might be wondering now if solar energy is financially worthwhile, with the steep installation cost. But there are more numbers that need to be worked through first, so stick with me for a few more sections.
Net metering
Although overall we produce less energy than we consume, there are many moments at the brightest parts of the day when we produce more than we consume at that moment. We don’t have a battery to hold onto that energy for another time (like at night when there is no solar energy), so that excess energy flows back into the power grid for someone else to use. With “net metering,” any energy that flows back into the power grid is credited to our utility bill.
Since grid power is at least probably 80% from non-renewable sources, our excess is mostly offsetting non-renewable energy.
Without net metering, we’d have to install a battery to make use of the excess energy at another time. With net metering, the grid basically acts as an infinite-capacity (and free!) battery taking any excess when we have it and giving it back to us (and more, of course) when we need it.
I should note that because we didn’t purchase a battery our panels won’t provide power if the electric grid goes down. This is apparently for the safety of power grid technicians working on the grid while it’s down, who don’t want to be electrocuted by power flowing into the grid from our system. Battery backup power is a more expensive and complex setup (and creating lithium batteries is not without its own negative impact on the environment) that we didn’t purchase, but you could.
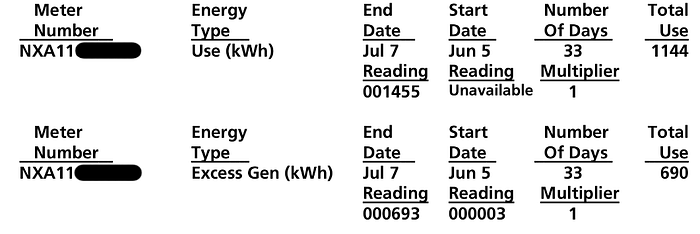
Net metering is nicely itemized on our utility bill. From our first full-month utility bill after installing the panels, we consumed 1,144 kWh from the grid and sent back 690 kWh in excess.
Computing total consumption
Counter-intuitively, how much energy you consume isn’t really important to the value of the solar panels if you have net metering. The amount of energy the panels produce (and your financial savings) doesn’t depend at all on how much you consume. But consumption is helpful to put your energy production in context.
From the solar panels’ production report for the same month as in the utility bill above, we produced 1,317 kWh in the same time period:
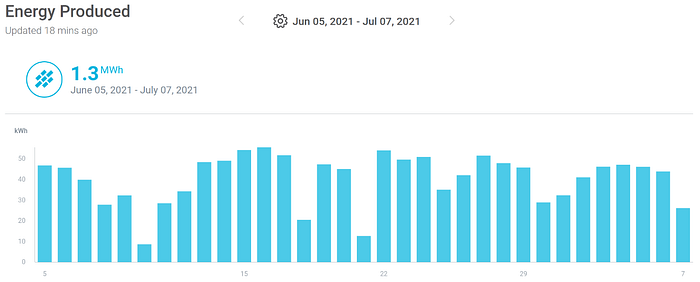
Add that to the power taken from the grid (1,144 kWh), and then subtract what we gave to the grid (690 kWh), to get the total energy we consumed: 1,771 kWh. So we produced 1,317 kWh and consumed 1,771 kWh. This was in a nice summer month.
We’ll have less energy usage in spring and fall without air conditioning or heat but still pretty good solar production. In the winter, our heating furnace is powered by natural gas — not electricity. So we can’t offset the energy usage with solar energy directly. But because we still have the advantage of net metering (which makes energy mostly “fungible”), the advantage of solar to our bottom line and to the environment is about the same.
The SREC market
On top of everything I’ve mentioned so far, there is another completely separate monetary benefit: SRECs. Keep in mind that this is double-dipping. It’s a benefit completely separate from the electricity we produce.
On top of the benefits of producing our own power and net metering, here in D.C. and elsewhere, solar energy producers are credited some fake tokens — called Solar Renewable Energy Certificates (SRECs) — for each megawatt-hour of solar power produced (regardless of what we consume). Electric power utilities then purchase those tokens from owners like us to offset penalties in local laws for non-renewable energy production. The transactions happen on an open market.
It’s double-dipping: For each megawatt-hour of solar energy that we produce, we get both the energy bill savings (including any net metering credits) and also we are credited one SREC token which we can then sell. That’s regardless of whether we consume that energy. Here in D.C. the penalty to the power utility for non-renewable energy production is especially high, making SRECs unusually valuable.
The market price in D.C. was about $400 per 1 MWh generated (one SREC) at the time we installed the panels, but after the ~7% transaction fee to our broker and regular income tax that we’ll end up paying each April (it’s income!) we stand to earn only about $300 per SREC at that market rate and given a rough estimate of our marginal tax rate. The 1.3 MWh solar production in our first billing month was worth about $390! That was about twice as much as the actual cost savings that month from the solar power.
In our first year, we sold about $2,500 worth of SRECS, which after taxes is really worth about $1,875.
Again, D.C.’s SREC market is particularly good.
But supply and demand on this market could dramatically change in the coming years in a way that could reduce the value of SRECs. More solar panels will come online (increasing supply) and the statutory penalty for non-renewable energy production may decline (decreasing demand). In D.C., current law sets a 40% decline in the penalty over the next 20 year. Of course, the law can also be changed at any time, and it’s plausible that progressive policies will be enacted to increase the penalty (and therefore increase the value of SRECs) as the impact of climate change becomes more urgent. (Some solar installers offer a financing method where they keep the SRECs and in turn lower the up-front cost to the homeowner. These installers are betting on the future value of SRECs to recoup their upfront costs, and this suggests SRECs will remain valuable for the foreseeable future. This financing option also expands access to solar energy, which is good.)
Note that for “small facilities” like single-family homes with less than 10 kW output, SRECs may be awarded based on “production estimates” determined by the panels’ total output rating (in our case, a little over 8 kW) rather than by monitoring your actual solar panels’ production. But as internet-connected monitoring equipment gets cheaper, regulations will probably move toward replacing estimates with actual values.
The Costs
Installation
The cost of the panels & installation was about $28,000. This will be offset by the generous 26% federal solar energy tax credit in next year’s taxes (but if you’re planning on going solar, this credit may have expired by the time you’re reading this).
When choosing a company to install the panels, the main cost consideration (which of course is not the only consideration) is the cost per watt of production, which is the production rating of the panels (in watts) times the number of panels. You want the most power at the least upfront cost. This came out to an installation cost of $2.62 per watt after the tax credit. (I also used the solar panel manufacturer’s warranty to estimate future production: Our REC365 panels have a 92% power output warranty at the end of the 25th year. The rated output may not be the true output over the next few decades, and when comparing installation proposals that use different manufacturers’ panels, factoring in differences in expected future output might be relevant. And these warranty estimates might even be overly optimistic.)
There’s also the opportunity cost of the up-front investment (cash that becomes unavailable from the time of the deposit until the cost is recouped), which if we assume is invested at a 4% return is in the ballpark of $3,000.
The total installation cost, including the tax credit and approximate opportunity cost, was therefore about $25,000.
Maintenance
We don’t yet have any numbers for maintenance costs. Or, rather, so far maintenance has been $0, but that will likely change due to:
- Maintenance for the panels themselves and its monitoring components.
- Higher maintenance costs for the roof, if the panels (or possibly worse, the ballasts holding the panels) have to be temporarily removed for better access to the roof. Our installer said that temporarily removing all of the panels would cost in the ballpark of $1,500 (they gave a real number but I forgot what it was and haven’t needed to know yet).
But let’s guess. If we had to remove our panels from the roof four times in 30 years, and had no other maintenance costs, the cost averaged out over those 30 years would be about $200 per year.
Our homeowner’s insurance also increased by $9/year to cover the replacement cost of the solar panels. (This is too small to worry about and isn’t actually a net cost, since we stand to benefit from the insurance coverage in the event of a disaster.)
Environmental
Manufacturing, shipping, and installation of the panels are not without a cost to the environment. And when the panels reach their end of life in 30 or so years, the toxic components in the panels will become hazardous waste.
Will it pay for itself?
Our solar installer projected that through the lower utility bill, SREC credits, and federal tax credit we would recoup the installation cost in around 6 years. But because of panel output decline, unpredictable future electricity prices, unpredictable value of future SRECs, unknown maintenance costs, and even climate change or developments in the buildings or foliage around us that might impact the amount of sunlight on the panels, it’s impossible to know.
In our first year, the total savings (from electricity and SRECs) was about $2,933. If that keeps up, we’re recoup the investment in about 9 years. But if the value of SREC’s goes down, say to zero after a decade, it might take around 11 years. Even so, the panels would still have long life ahead of them.
Notice that whether the panels pay for themselves doesn’t depend on energy consumption. The panels will generate the same electricity — and the same financial benefit — regardless of how much energy your house consumes. (Assuming you have ‘net metering’ or a battery that you never fill to capacity.)
SRECs’ unusually high value in DC are crucial for recouping the cost. Without that, we would likely recoup the cost only over the lifetime of the panels.